Maps of All 50 States
Pick a state to open its map. Every state page includes a zoomable map with major cities and county boundaries, quick facts, a locator map and a free printable outline.
 AlabamaMontgomery
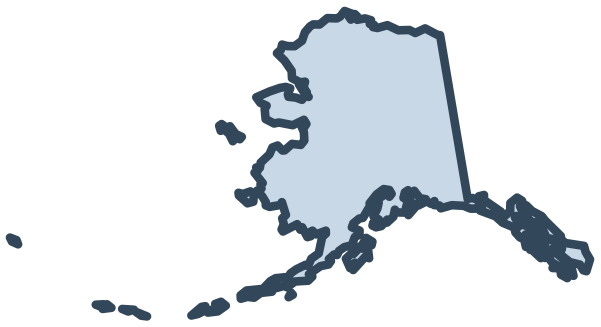 AlaskaJuneau
 ArizonaPhoenix
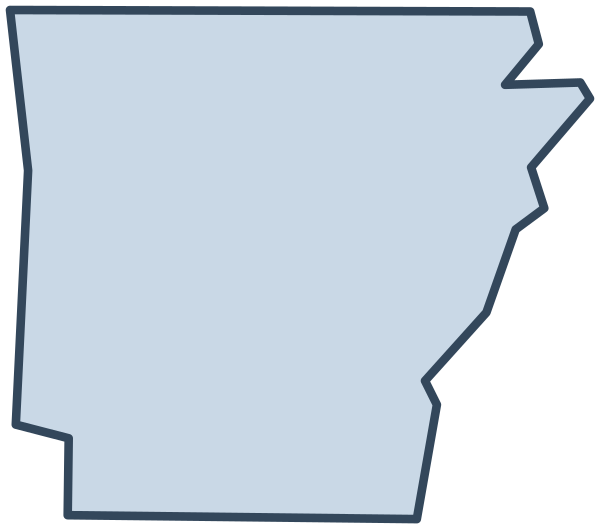 ArkansasLittle Rock
 CaliforniaSacramento
 ColoradoDenver
 ConnecticutHartford
 DelawareDover
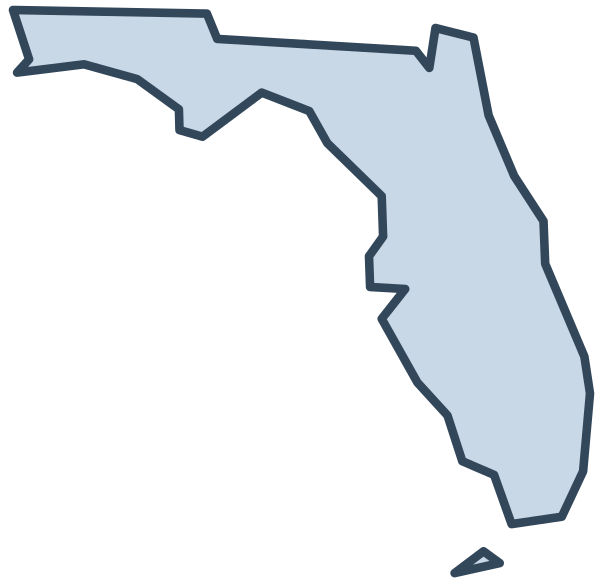 FloridaTallahassee
 GeorgiaAtlanta
 HawaiiHonolulu
 IdahoBoise
 IllinoisSpringfield
 IndianaIndianapolis
 IowaDes Moines
 KansasTopeka
 KentuckyFrankfort
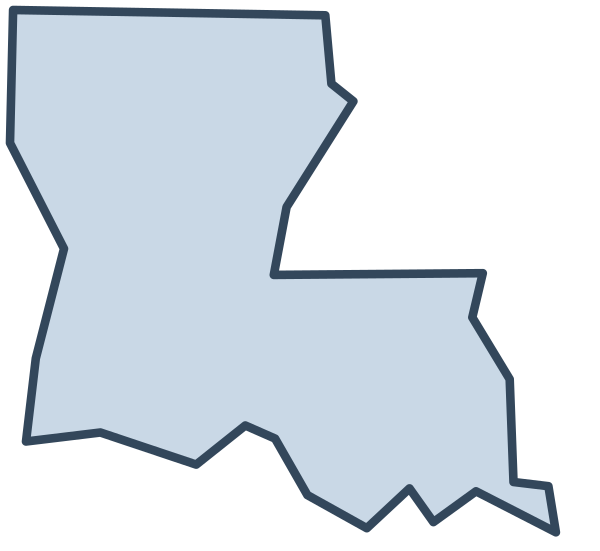 LouisianaBaton Rouge
 MaineAugusta
 MarylandAnnapolis
 MassachusettsBoston
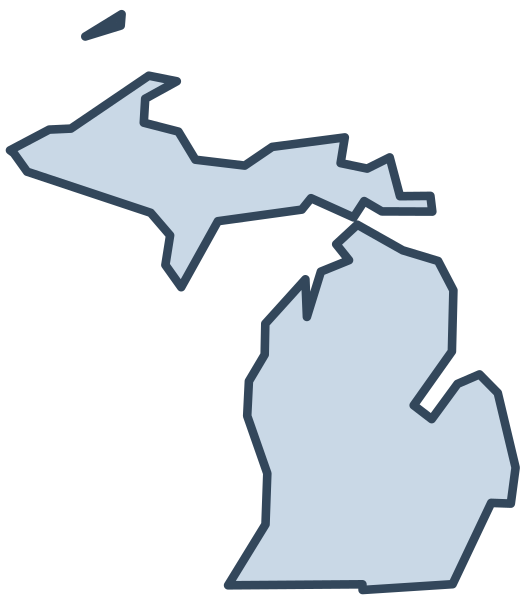 MichiganLansing
 MinnesotaSaint Paul
 MississippiJackson
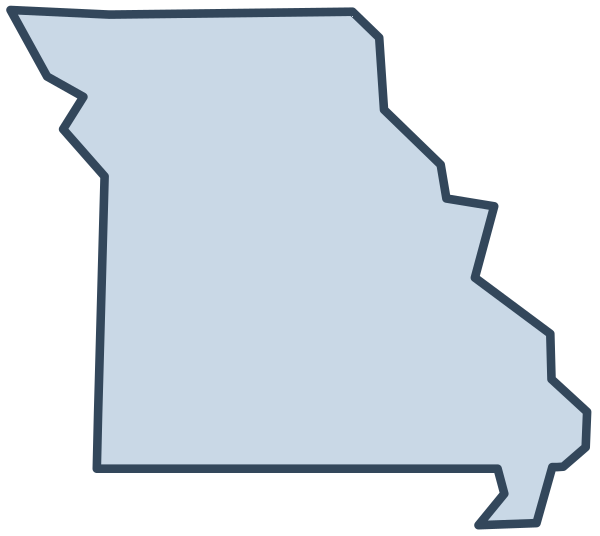 MissouriJefferson City
 MontanaHelena
 NebraskaLincoln
 NevadaCarson City
 New HampshireConcord
 New JerseyTrenton
 New MexicoSanta Fe
 New YorkAlbany
 North CarolinaRaleigh
 North DakotaBismarck
 OhioColumbus
 OklahomaOklahoma City
 OregonSalem
 PennsylvaniaHarrisburg
 Rhode IslandProvidence
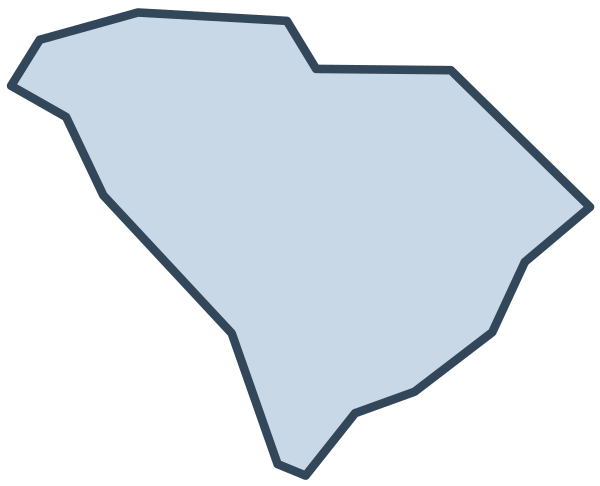 South CarolinaColumbia
 South DakotaPierre
 TennesseeNashville
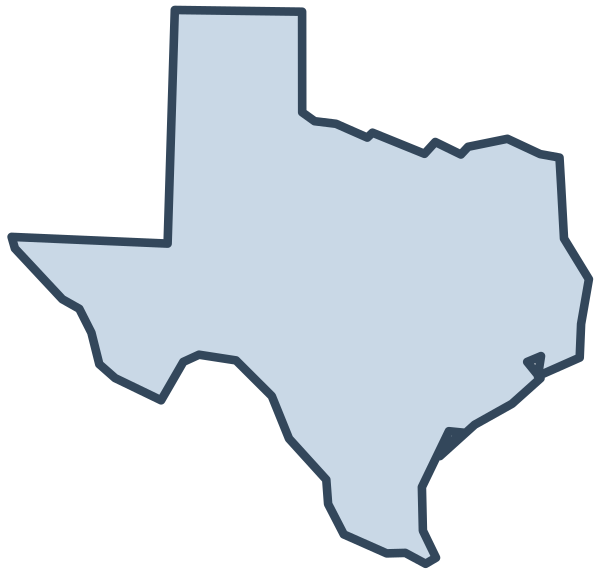 TexasAustin
 UtahSalt Lake City
 VermontMontpelier
 VirginiaRichmond
 WashingtonOlympia
 West VirginiaCharleston
 WisconsinMadison
 WyomingCheyenne
Every state also has a county map with a full list of counties, county seats and 2020 population (for example, the Texas county map). To compare states, see the states ranked by population, by size and by date of statehood.
States in order of statehood
The 13 original colonies became the first 13 states by ratifying the Constitution between 1787 and 1790. Delaware was first; Hawaii became the 50th state in 1959.
| Order | State | Date admitted | Region |
|---|---|---|---|
| 1 | Delaware | December 7, 1787 | South |
| 2 | Pennsylvania | December 12, 1787 | Northeast |
| 3 | New Jersey | December 18, 1787 | Northeast |
| 4 | Georgia | January 2, 1788 | South |
| 5 | Connecticut | January 9, 1788 | Northeast |
| 6 | Massachusetts | February 6, 1788 | Northeast |
| 7 | Maryland | April 28, 1788 | South |
| 8 | South Carolina | May 23, 1788 | South |
| 9 | New Hampshire | June 21, 1788 | Northeast |
| 10 | Virginia | June 25, 1788 | South |
| 11 | New York | July 26, 1788 | Northeast |
| 12 | North Carolina | November 21, 1789 | South |
| 13 | Rhode Island | May 29, 1790 | Northeast |
| 14 | Vermont | March 4, 1791 | Northeast |
| 15 | Kentucky | June 1, 1792 | South |
| 16 | Tennessee | June 1, 1796 | South |
| 17 | Ohio | March 1, 1803 | Midwest |
| 18 | Louisiana | April 30, 1812 | South |
| 19 | Indiana | December 11, 1816 | Midwest |
| 20 | Mississippi | December 10, 1817 | South |
| 21 | Illinois | December 3, 1818 | Midwest |
| 22 | Alabama | December 14, 1819 | South |
| 23 | Maine | March 15, 1820 | Northeast |
| 24 | Missouri | August 10, 1821 | Midwest |
| 25 | Arkansas | June 15, 1836 | South |
| 26 | Michigan | January 26, 1837 | Midwest |
| 27 | Florida | March 3, 1845 | South |
| 28 | Texas | December 29, 1845 | South |
| 29 | Iowa | December 28, 1846 | Midwest |
| 30 | Wisconsin | May 29, 1848 | Midwest |
| 31 | California | September 9, 1850 | West |
| 32 | Minnesota | May 11, 1858 | Midwest |
| 33 | Oregon | February 14, 1859 | West |
| 34 | Kansas | January 29, 1861 | Midwest |
| 35 | West Virginia | June 20, 1863 | South |
| 36 | Nevada | October 31, 1864 | West |
| 37 | Nebraska | March 1, 1867 | Midwest |
| 38 | Colorado | August 1, 1876 | West |
| 39 | North Dakota | November 2, 1889 | Midwest |
| 40 | South Dakota | November 2, 1889 | Midwest |
| 41 | Montana | November 8, 1889 | West |
| 42 | Washington | November 11, 1889 | West |
| 43 | Idaho | July 3, 1890 | West |
| 44 | Wyoming | July 10, 1890 | West |
| 45 | Utah | January 4, 1896 | West |
| 46 | Oklahoma | November 16, 1907 | South |
| 47 | New Mexico | January 6, 1912 | West |
| 48 | Arizona | February 14, 1912 | West |
| 49 | Alaska | January 3, 1959 | West |
| 50 | Hawaii | August 21, 1959 | West |
States ranked by size and population
10 largest states by area
- Alaska: 665,384 sq mi
- Texas: 268,596 sq mi
- California: 163,695 sq mi
- Montana: 147,040 sq mi
- New Mexico: 121,590 sq mi
- Arizona: 113,990 sq mi
- Nevada: 110,572 sq mi
- Colorado: 104,094 sq mi
- Oregon: 98,379 sq mi
- Wyoming: 97,813 sq mi
10 most populous states (2020)
- California: 39,538,223
- Texas: 29,145,505
- Florida: 21,538,187
- New York: 20,201,249
- Pennsylvania: 13,002,700
- Illinois: 12,812,508
- Ohio: 11,799,448
- Georgia: 10,711,908
- North Carolina: 10,439,388
- Michigan: 10,077,331
See the complete sortable table of capitals, population and area on the US state map home page.