US States by Population
This ranking lists all 50 US states by population from the 2020 Census, from California (39,538,223 residents) to Wyoming (576,851). The map shades each state by its population, and the table below can be sorted by any column.
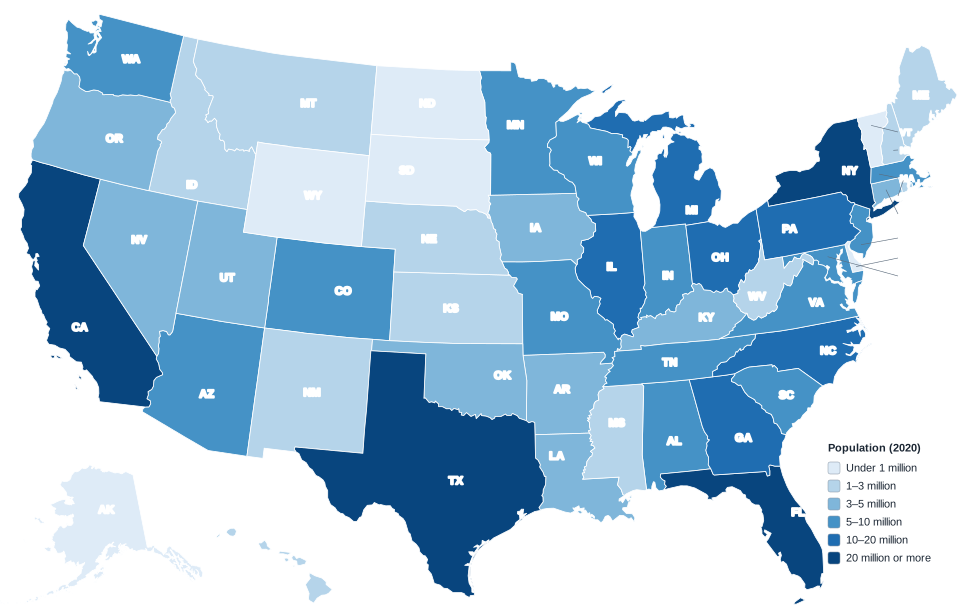
Each state is shaded into one of six population classes using the 2020 Census resident count. Darker blue means more people. Washington, D.C., is not a state and is not ranked.
All 50 states ranked by population (2020 Census)
| Rank | State | Population (2020) | Share of US | Region |
|---|---|---|---|---|
| 1 | California | 39,538,223 | 11.93% | West |
| 2 | Texas | 29,145,505 | 8.79% | South |
| 3 | Florida | 21,538,187 | 6.50% | South |
| 4 | New York | 20,201,249 | 6.09% | Northeast |
| 5 | Pennsylvania | 13,002,700 | 3.92% | Northeast |
| 6 | Illinois | 12,812,508 | 3.87% | Midwest |
| 7 | Ohio | 11,799,448 | 3.56% | Midwest |
| 8 | Georgia | 10,711,908 | 3.23% | South |
| 9 | North Carolina | 10,439,388 | 3.15% | South |
| 10 | Michigan | 10,077,331 | 3.04% | Midwest |
| 11 | New Jersey | 9,288,994 | 2.80% | Northeast |
| 12 | Virginia | 8,631,393 | 2.60% | South |
| 13 | Washington | 7,705,281 | 2.32% | West |
| 14 | Arizona | 7,151,502 | 2.16% | West |
| 15 | Massachusetts | 7,029,917 | 2.12% | Northeast |
| 16 | Tennessee | 6,910,840 | 2.09% | South |
| 17 | Indiana | 6,785,528 | 2.05% | Midwest |
| 18 | Maryland | 6,177,224 | 1.86% | South |
| 19 | Missouri | 6,154,913 | 1.86% | Midwest |
| 20 | Wisconsin | 5,893,718 | 1.78% | Midwest |
| 21 | Colorado | 5,773,714 | 1.74% | West |
| 22 | Minnesota | 5,706,494 | 1.72% | Midwest |
| 23 | South Carolina | 5,118,425 | 1.54% | South |
| 24 | Alabama | 5,024,279 | 1.52% | South |
| 25 | Louisiana | 4,657,757 | 1.41% | South |
| 26 | Kentucky | 4,505,836 | 1.36% | South |
| 27 | Oregon | 4,237,256 | 1.28% | West |
| 28 | Oklahoma | 3,959,353 | 1.19% | South |
| 29 | Connecticut | 3,605,944 | 1.09% | Northeast |
| 30 | Utah | 3,271,616 | 0.99% | West |
| 31 | Iowa | 3,190,369 | 0.96% | Midwest |
| 32 | Nevada | 3,104,614 | 0.94% | West |
| 33 | Arkansas | 3,011,524 | 0.91% | South |
| 34 | Mississippi | 2,961,279 | 0.89% | South |
| 35 | Kansas | 2,937,880 | 0.89% | Midwest |
| 36 | New Mexico | 2,117,522 | 0.64% | West |
| 37 | Nebraska | 1,961,504 | 0.59% | Midwest |
| 38 | Idaho | 1,839,106 | 0.55% | West |
| 39 | West Virginia | 1,793,716 | 0.54% | South |
| 40 | Hawaii | 1,455,271 | 0.44% | West |
| 41 | New Hampshire | 1,377,529 | 0.42% | Northeast |
| 42 | Maine | 1,362,359 | 0.41% | Northeast |
| 43 | Rhode Island | 1,097,379 | 0.33% | Northeast |
| 44 | Montana | 1,084,225 | 0.33% | West |
| 45 | Delaware | 989,948 | 0.30% | South |
| 46 | South Dakota | 886,667 | 0.27% | Midwest |
| 47 | North Dakota | 779,094 | 0.24% | Midwest |
| 48 | Alaska | 733,391 | 0.22% | West |
| 49 | Vermont | 643,077 | 0.19% | Northeast |
| 50 | Wyoming | 576,851 | 0.17% | West |
Share of US is each state’s share of the total resident population of 331,449,281, which includes Washington, D.C. (689,545). The 50 states together had 330,759,736 residents.
Most and least populous states
The four largest states, California, Texas, Florida and New York, had 110,423,164 residents combined: 33.3% of the country. Ten states passed 10 million: California, Texas, Florida, New York, Pennsylvania, Illinois, Ohio, Georgia, North Carolina and Michigan.
California alone has more people than the 21 least populous states combined (37,174,921). It has about 69 times as many residents as Wyoming.
Six states had fewer than 1 million people: Delaware, South Dakota, North Dakota, Alaska, Vermont and Wyoming. Washington, D.C., with 689,545 residents, is larger than Vermont and Wyoming.
Size and population rarely match. Alaska is the largest state by area but ranks 48th in population, while New Jersey ranks 47th in area and 11th in population. See the US states by size ranking.
Population by region
Totals for the four Census regions in 2020:
South
126,266,107 people (38.1% of the US). 16 states plus D.C. The South total includes D.C.; the 16 states alone had 125,576,562. Most populous state: Texas.
West
78,588,572 people (23.7% of the US). 13 states. California holds 50.3% of the region’s population. Most populous state: California.
Midwest
68,985,454 people (20.8% of the US). 12 states. Most populous state: Illinois.
Northeast
57,609,148 people (17.4% of the US). 9 states. Most populous state: New York.
2020 Census and seats in the House
The census decides how the 435 seats in the U.S. House of Representatives are divided among the states. The apportionment count adds federal employees living overseas, mostly military personnel, and their dependents to each state’s resident population, so it is slightly different from the figures above. The 2020 results took effect with the 2022 elections.
- Largest delegations: California has 52 seats and Texas 38.
- Gains: Texas gained two seats; Colorado, Florida, Montana, North Carolina and Oregon gained one each.
- Losses: California, Illinois, Michigan, New York, Ohio, Pennsylvania and West Virginia lost one seat each.
- One seat: Alaska, Delaware, North Dakota, South Dakota, Vermont and Wyoming each elect a single at-large representative.
A state’s electoral votes equal its House seats plus two, so the same count shapes presidential elections.
Frequently asked questions
What is the most populous US state?
California, with 39,538,223 residents in the 2020 Census, about 11.9% of the US population.
What is the least populous state?
Wyoming, with 576,851 residents in 2020. Vermont (643,077) is second smallest.
How many people live in the 50 states?
330,759,736 at the 2020 Census. Adding Washington, D.C., gives a US resident population of 331,449,281.
Which region has the most people?
The South, with 126,266,107 people including D.C. (38.1% of the US).
When is the next census?
The census is taken every 10 years. The next one is in 2030.
Related maps and lists
US states by size
All 50 states ranked by total area in sq mi and km².
States in order of statehood
The date each state joined the Union, 1787 to 1959.
US regions map
The four Census regions and nine divisions.
US map with capitals
Every state capital marked, with a full list.
State abbreviations
USPS codes and AP style abbreviations for every state.
All 50 state maps
A map, quick facts and printable outline for each state.
Sources: U.S. Census Bureau (2020 Census population and apportionment, boundaries). Last reviewed October 2026.